ExpoFP Presents Floor Plan Analytics

At ExpoFP, we not only design custom floor plans that automate event management processes, show agendas and make navigation easier with digital wayfinding, but also provide our customers with valuable insights through our post-show reports.
Now, the analytics is available in your account.
What data can you see?
- Total views: number of times the floor plan was loaded
- Total users: number of unique users
- Total sessions: number of active interactions of users.
- Top searches: the most popular items that users looked for on the floor plan.
- Top routes: most popular routes with origins and destinations.
- Top exhibitors: Every time an exhibitor's name is found in search results or when a user clicks on a company name in the exhibitor list or booth with an exhibitor assigned to it, it's counted in this section.
- Top booths: The booths that people clicked on the most.
- Top categories: Refers to categories in the exhibitor profile or in the exhibitor list.
Why is this important?
Our analytics helps you to:
- Make data-driven decisions.
- Understand which exhibitors are the most popular.
- See what sponsorship options are particularly helping your exhibitors get noticed.
- Evaluate the users engagement with the floor plan.
The last one is crucial if you are an agency or association that works with many clients and needs to prove the efficiency of floor plans.
Where to check?
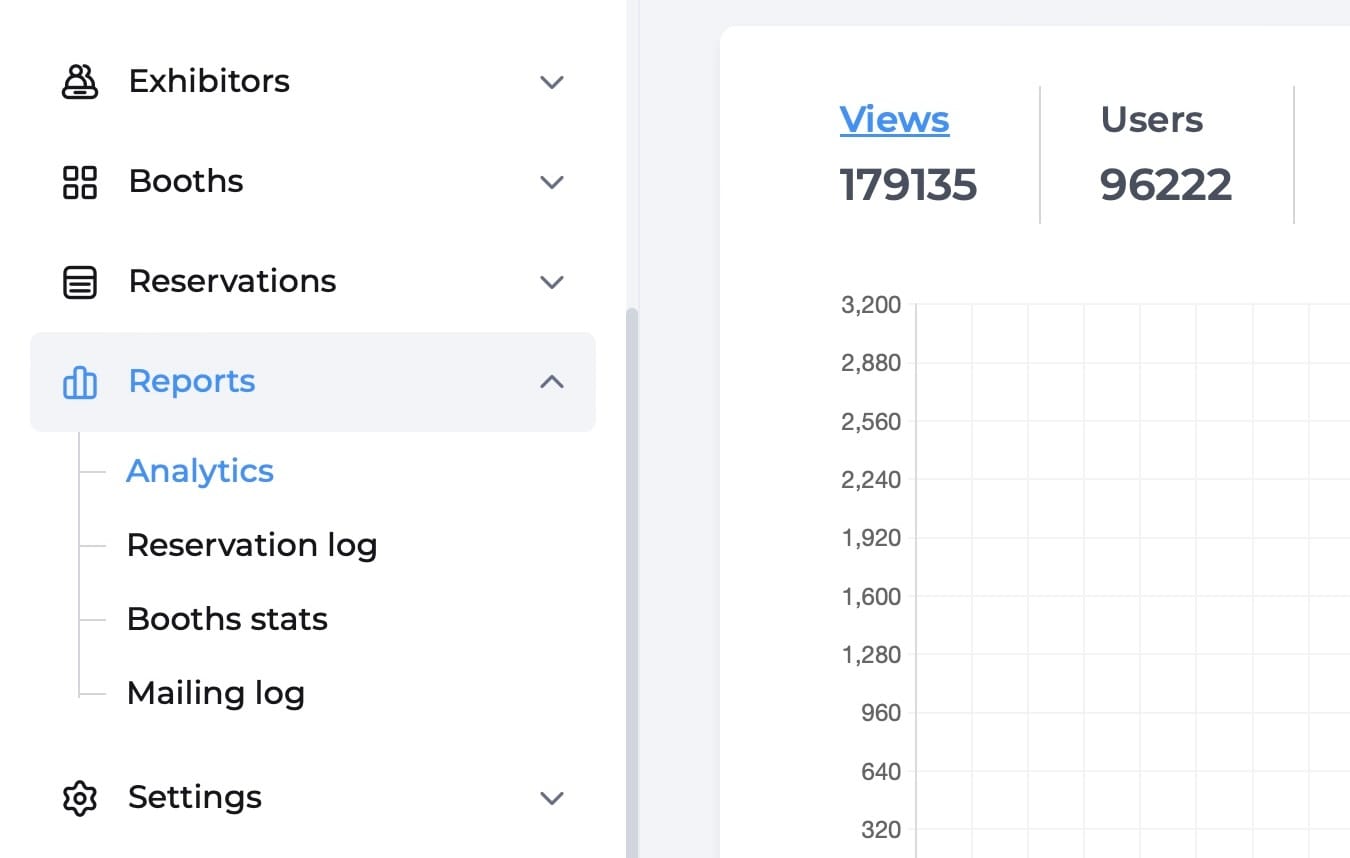
On the dashboard, click Reports>Analytics and enjoy the data.

You can select a time period to view analytics. By default, it shows data for the last 7 days, but you can also see data for the duration of the show or the entire time since the floor plan was created.
You can export analytics in csv format.
For example, here is how popular our floor plans among the attendees of APAS Show, the biggest F&B trade show in the Americas, was. It got 179,135 views and almost 100,00 unique users.
If you want to learn more about analytics, read this article in our Help Center.


