Your floor plan already knows who your next sponsors are
Turn post-event floor plan analytics into sponsorship opportunities. See how ExpoFP reports reveal attendee intent, exhibitor engagement, wayfinding demand, and the brands already attracting attention.
ExpoFP now sends every organizer an automatic post-event intelligence report, plus ready-to-forward cards for their top exhibitors. Here is what's inside and how to use it to sell next year's sponsorship.
Every event leaves a trail of data on its floor plan. Attendees search for brands, open exhibitor profiles, ask for directions and tap kiosk screens. Until now, most of that sat in a dashboard nobody had time to open after the show.
So we stopped waiting for organizers to come and look. Once an event ends, ExpoFP now builds a post-event report from the floor plan analytics and sends it straight to the organizer's inbox. No setup, no export, no analyst.
We started with every event that ended in September 2026 and had at least 1,000 floor plan views: 46 reports went to 37 organizers in the first wave. The next 50 are in progress, and about 200 events since March are in the queue.
What's inside the organizer report
The report follows one rule: what happened, why it matters, what to do next, and how to monetize it. Every recommendation is tied to a number from your own event.
|
Section |
What it answers |
|
Headline metrics |
Map views, sessions, route requests and searches for the reporting period |
|
Engagement lifecycle |
How the map
was used before
the show versus during it, day by day, with the peak day and busiest hour |
|
Attendee intent |
What visitors typed into search, split into brands, topics and places |
|
Exhibitor attention |
Which exhibitors got the most profile views and branded
searches |
|
Section |
What it answers |
|
Wayfinding demand |
Where attendees asked to be routed, and from where |
|
Digital hotspots |
Which stages, lounges, places and categories drew the most attention |
|
Kiosk
performance |
Views per onsite kiosk, and which units earned their place |
|
Commercial performance |
Booths reserved, area sold and what was still open |
|
Next-event plan |
Concrete sponsorship and operations actions for the next edition |
A few patterns from the first wave already stand out.
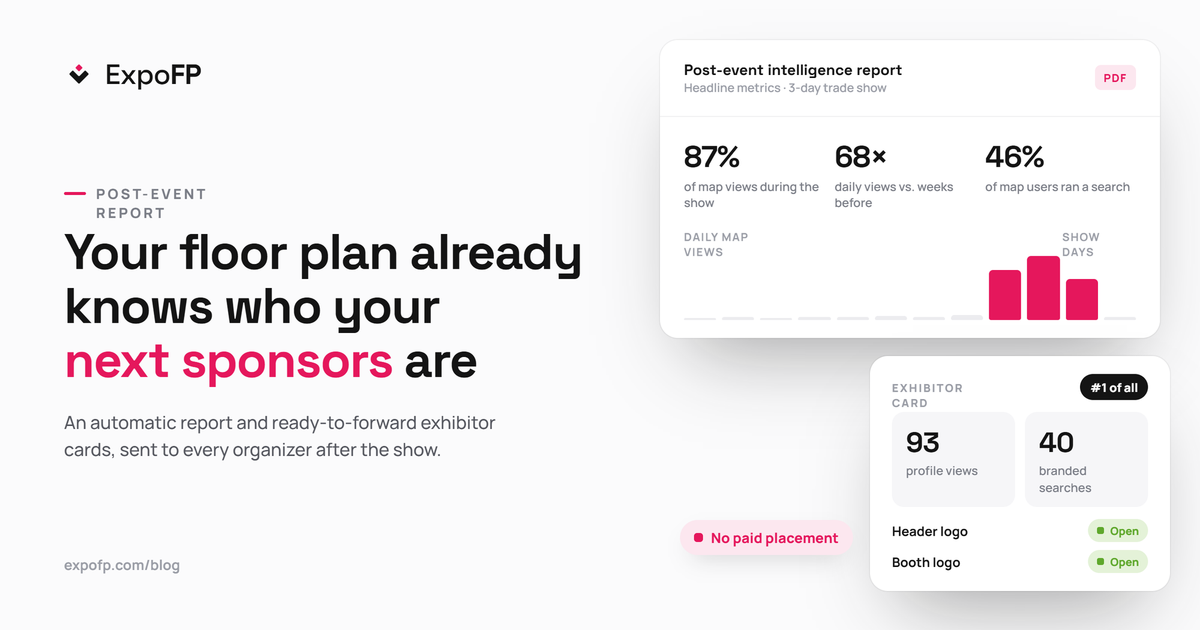
The map is an onsite tool. At a three-day hospitality trade show in Europe, 87% of map views and virtually all searches and route requests happened during the show. Daily views jumped 68 times compared to the weeks before. That tells an organizer exactly where to put effort: the map link on badges, signage and the app home screen.
Search reveals intent. At the same show, 46% of map users ran a search, averaging almost 15 queries each. At an AI infrastructure conference in California, attendees ran 9,434 searches. Brand names typed into search show demand a company already owns. Topic keywords show demand nobody owns yet.
Kiosks are not equal. At the AI infrastructure conference, the two busiest of ten kiosks took 38% of all kiosk views, while the quietest recorded almost none. Location and setup matter, and the report shows which units to replicate and which to move.
Turning organic attention into 2027 sponsorship
The most useful finding is a simple one: the exhibitors attendees looked for most were usually the ones who paid for nothing on the map.
At the AI infrastructure conference, the most-viewed exhibitor drew 93 profile views without any paid placement. A major chipmaker was searched by name 40 times, also unsponsored. Across both events in our examples, nobody had bought a header logo, a booth logo or a featured listing.
That is an easy sales conversation. You are not asking a company to buy visibility and hope it works. You are showing them demand they already have, and offering to amplify it with numbers to prove the result.
Each report turns this into a ready package ladder for the next edition:
1. Visibility. Logo in the floor plan header.
2. Presence. Header plus logo on the booth.
3. Premium. Header, booth logo and a featured listing.
4. Measured. Any placement plus a sponsor performance report against this year's baseline.
Beyond exhibitor placements, the report points to new surfaces that carry attention: search results for high-demand keywords, the most opened exhibitor categories, organizer-owned destinations like stages and lunch areas, and the busiest kiosks. Header logo, booth logo and featured listing are available today; category, destination, search and kiosk sponsorships are concepts we are developing, and the report shows where they would pay off first.
One-page cards for your top exhibitors
Alongside the full report, organizers get one-page cards for the top exhibitors who had no paid map placement. Each card is written to the exhibitor and can be forwarded as is.
A card shows the exhibitor's profile views, their rank among all exhibitors, branded searches, and the event's overall map demand. It lists the placements nobody claimed this year and ends with a clear offer: buy visibility for the next edition, and we will report the result against this year's baseline.
For an organizer's sales team, that replaces a cold upsell email with a personal, data-backed proposal. For the exhibitor, it is proof that attendees were already looking for them.
How you get it
You do not need to do anything. After your event ends, the report arrives from support
expofp.com with the subject line "See what drove engagement at" followed by your event name. The email gives you the headline numbers, a link to the Analytics section of your dashboard, and the PDF report with exhibitor cards attached.
Reports come in three versions depending on the event: a base report, a report with a sponsorship section, and a report with kiosk analytics for events that used onsite kiosks.
The first organizers have already replied. One told us the feature is "really helpful and saves us a lot of time". Their questions are already shaping the next version.
Want to turn your report into a priced sponsorship package? Book a demo and we will walk through your numbers and build next year's inventory with you.