
Trade Show Industry Statistics 2026: The Numbers Behind Exhibitions
Explore the key trade show industry statistics for 2026, including market growth, exhibitor spending, attendee behavior, economic impact, and technology trends.
The global exhibition industry is valued at $45.5 billion in 2026, hosting roughly 32,000 exhibitions a year across more than 1,500 venues worldwide, according to UFI’s Global Exhibition Industry Statistics report. Below is a sourced breakdown of the numbers organizers and exhibitors are using to plan budgets, staffing, and floor plans for the year ahead — market size, spending patterns, attendee behavior, and where the growth is (and isn’t) coming from.
We pulled these figures from primary industry sources — UFI (the Global Association of the Exhibition Industry), CEIR (Center for Exhibition Industry Research), and IAEE — rather than estimating, and we’ve linked to each source so you can check the underlying report yourself.
Market size and growth
- The global exhibition industry is valued at $45.5 billion in 2026, projected to reach $67.4 billion by 2033 at a 5.8% CAGR. (UFI/GEIS coverage)
- Worldwide, the industry recorded 32,000 exhibitions, 138 million square meters of rented exhibition space, 4.7 million exhibiting companies, and 318 million visitors in 2024 — the most recent full-year figures in UFI’s April 2026 Global Exhibition Industry Statistics report. Total space is still slightly below the pre-pandemic 2019 level of 143.7 million square meters.
- The U.S. B2B exhibition industry, tracked via the CEIR Total Index, is forecast to grow 2.1% in 2026, driven by increases in net square feet sold, professional attendance, exhibiting companies, and forward bookings, per IAEE’s release of the 2026 CEIR Index report.
- Large exhibitions are performing especially well: CEIR found an average net profit margin of 55% among large shows, with 80% of organizers reporting profitability and median gross revenue of $12.5 million.
Economic impact
- Exhibitions generated €150 billion (~$162 billion) in direct output in 2024. Including indirect and induced effects, total global economic impact reaches €368 billion (~$398 billion) in output and €215 billion (~$233 billion) in GDP contribution — supporting an estimated 4.3 million full-time-equivalent jobs worldwide (UFI GEIS, April 2026).
- Sentiment for 2026 is cautiously positive but uneven: 31% of companies reported profit growth of more than 10% in 2025, and 33% forecast similar growth for 2026 — but trade policy uncertainty, elevated costs, and geopolitical tensions are cited as ongoing risk factors for international participation.
Exhibitor spending
- Companies allocate an average of 31.6% of their total marketing budget to events and trade shows; within that, B2B exhibiting alone accounts for 40.8% of exhibitor marketing budgets — the single largest channel.
- Exhibit space now represents 40.5% of total exhibitor spend at a show, up from 37.9% in 2017. Booth space rental alone typically runs 30–35% of total event cost, with the remainder split across booth build/design, travel, staffing, shipping, and promotion.
- Median all-in exhibitor spending per show reached $32,400 in 2025 — a 14% increase from 2022. Mid-size exhibitors typically spend $25,000–$75,000 per show once travel, staffing, and materials are included.
- Looking ahead, 67% of event professionals expect trade show spend to increase in 2026, and 42% of exhibitors already increased budgets in 2025/2026 versus the prior year. Participation plans are similarly steady-to-growing: 47% plan to exhibit at the same number of shows, and 28% plan to add more.
For a breakdown of how that spend typically splits across booth size and location, see our guide to trade show booth pricing.
Attendee behavior
- 76% of attendees arrive with a pre-planned list of booths to visit, rather than browsing the floor cold — meaning the bulk of booth traffic decisions are made before the show opens, not on the floor.
- Exhibitors who run pre-show marketing (email, social, direct outreach inviting attendees to their booth) see 46% more booth visits than exhibitors who rely on walk-up traffic alone.
- Two-thirds or more of attendees rank face-to-face interaction as important at every stage of the buying journey — investigating, evaluating, and narrowing down a purchase decision — reinforcing why in-person exhibitions remain a distinct channel from digital marketing rather than a redundant one.
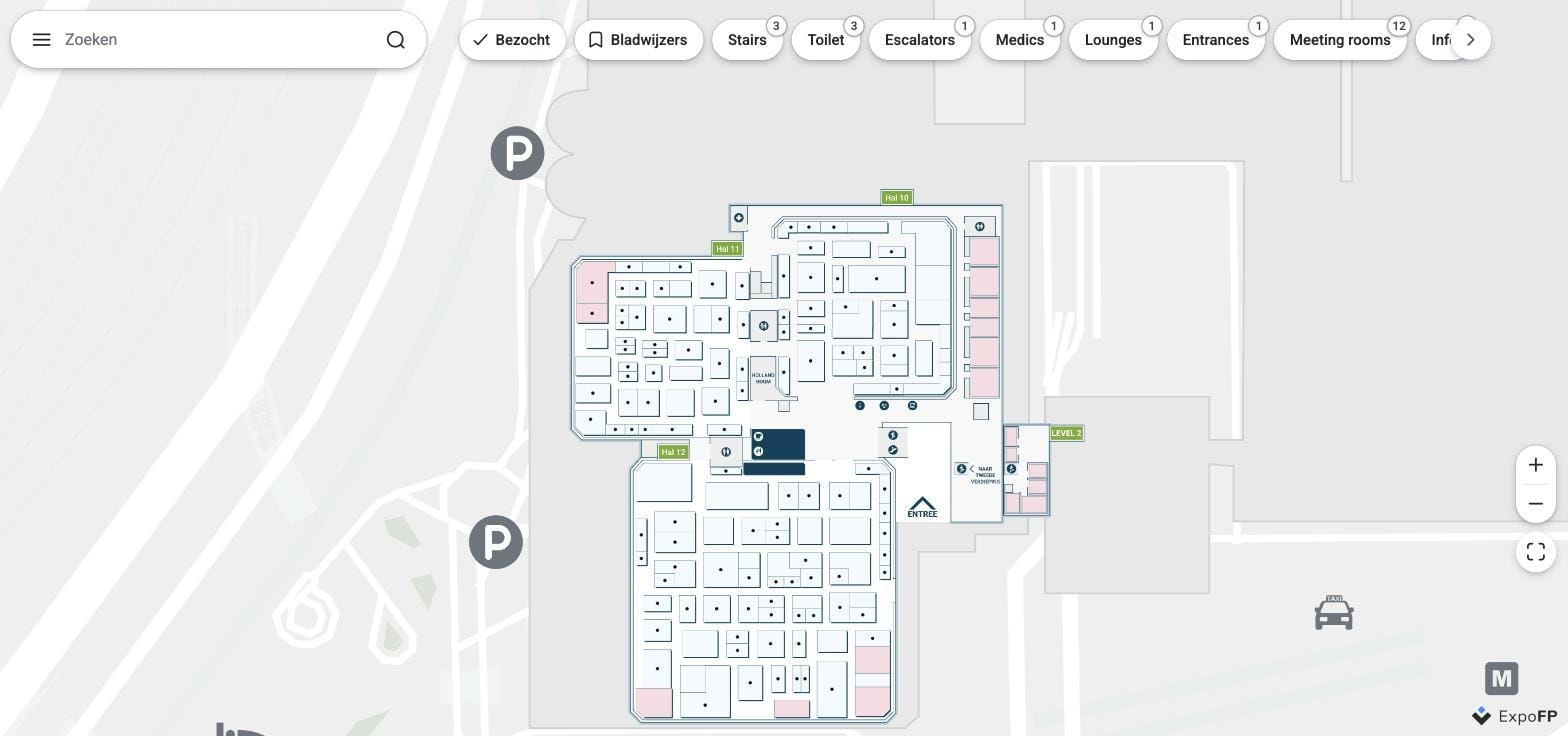
Since most booth-visit decisions happen before doors open, the floor plan itself becomes a pre-show marketing surface — see what an interactive floor plan actually is and how it’s used and our guide to real floor plan examples for how organizers turn that pre-show research window into engagement.
Technology adoption
- AI adoption in the exhibition industry has climbed sharply: 91% of companies reported using AI in some part of their operations as of June 2026, per UFI’s Global Exhibition Barometer — spanning everything from marketing content to matchmaking and lead scoring.
- Digital wayfinding and interactive floor plans continue to move from “nice to have” to standard infrastructure at mid-size and large shows, driven in part by the same pre-show planning behavior noted above: attendees expect to search for exhibitors and plan routes online before arriving, not just look at a printed map at the door.
Trade show industry statistics at a glance
FAQ
Is the trade show industry growing in 2026? Yes, on the whole. UFI values the global exhibition industry at $45.5 billion in 2026 with a projected 5.8% CAGR through 2033, and the U.S. CEIR Index is forecasting 2.1% growth for 2026. Growth isn’t uniform across regions or sectors, and trade policy and travel cost pressures remain risk factors cited by industry analysts.
How much do exhibitors typically spend per show? Median all-in exhibitor spending reached $32,400 in 2025, up 14% from 2022. Mid-size exhibitors commonly budget $25,000–$75,000 per show once booth space, build, travel, staffing, and shipping are all included — actual spend varies significantly by industry and booth size.
What percentage of attendees plan their visit in advance? 76% of attendees arrive with a pre-planned list of booths, according to CEIR research — which is why exhibitors who run pre-show marketing see meaningfully more booth traffic (a reported 46% lift) than those who don’t.
Are exhibition budgets increasing or shrinking? Directionally increasing: 67% of event professionals expect trade show spend to grow in 2026, and 42% of exhibitors already raised budgets in 2025/2026. Participation is stable to growing too, with 28% of exhibitors planning to add shows to their calendar.
Where do these statistics come from? Primarily UFI’s Global Exhibition Industry Statistics (April 2026) and Global Exhibition Barometer, and CEIR’s Total Index and related exhibitor/attendee research, both linked above. We didn’t estimate or round up any figures — where a range is given, it reflects a range reported in the original research.
Turning this level of pre-show research behavior into booth traffic starts with a floor plan attendees can actually explore before they arrive. Create your floor plan free and see how exhibitors and attendees use it in the weeks before your next show. For the operational side of getting there, see our 18-month trade show planning checklist.