Trade Show ROI: How Exhibitors and Organizers Measure It
Learn how exhibitors and organizers measure trade show ROI, from cost per lead and sales attribution to floor plan analytics, sponsorship ROI, and exhibitor renewals.
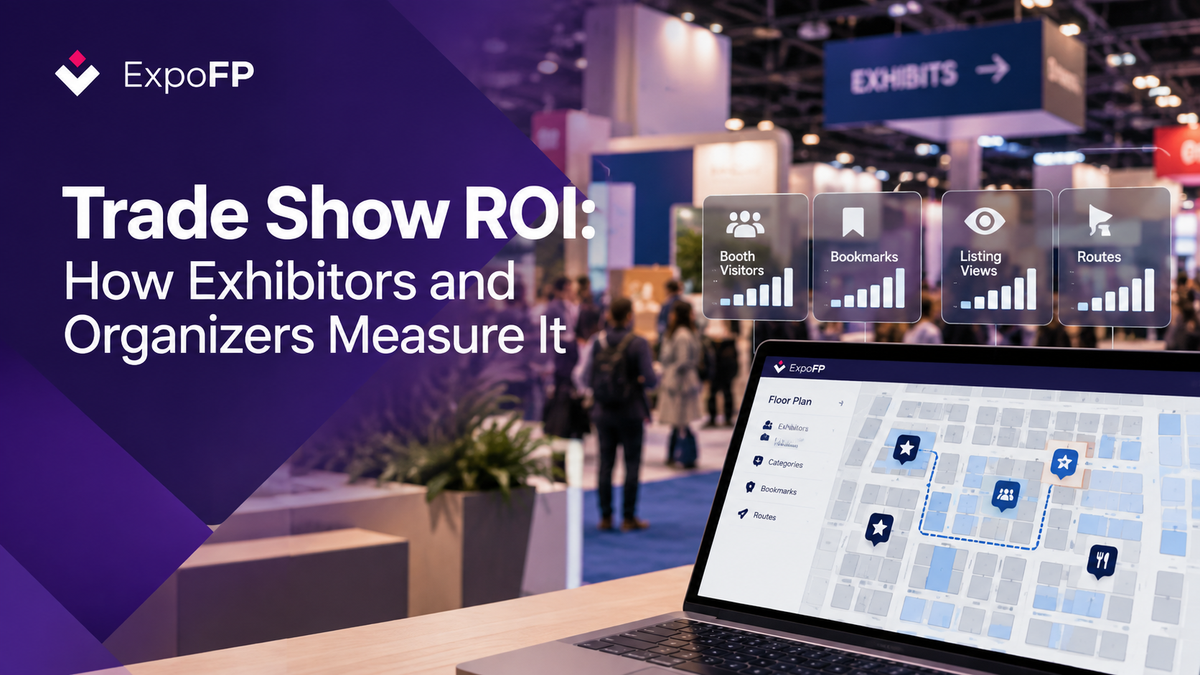
Trade show ROI shows whether the money and time invested in an event actually paid off.
The basic formula is:
Trade show ROI = (Revenue attributed to the show − Total show cost) ÷ Total show cost × 100
The formula itself is simple. The harder part is deciding what counts as revenue from the show, how long you continue tracking results after the event, and how you measure goals that are not directly tied to sales.
For exhibitors, trade show ROI usually means comparing leads, pipeline and closed deals with the total cost of exhibiting. For organizers, it is more about booth sales, exhibitor renewals, sponsorship revenue, attendee quality and the overall cost of running the event.
These two sides are closely connected. If exhibitors can prove that an event delivers value, they are more likely to come back next year.
Why trade show ROI matters in 2026
Trade shows remain a major part of B2B marketing budgets.
CEIR’s 2026 Marketing Spend Decision Report found that 40.8% of exhibitor marketing budgets go to B2B exhibiting, making it the largest marketing channel in the report. Exhibitor Net Promoter Score also increased from −6 in 2021 to 35.
The 2026 CEIR Index forecasts 2.1% growth for the exhibition industry, based on net square feet of exhibit space sold, professional attendance, number of exhibiting companies and gross revenue. UFI’s January 2026 Global Exhibition Barometer also reported that nearly half of respondents saw activity increase by more than 5% in 2025.
The takeaway is simple: companies are still investing heavily in trade shows, but they are paying closer attention to what they get in return.
For more industry data, see our trade show industry statistics for 2026.
Trade show ROI for exhibitors
Step 1: Calculate the full cost of exhibiting
One of the easiest ways to get an inaccurate ROI number is to count only the booth fee.
A realistic trade show budget includes:
| Cost category | Typical expenses | Notes |
|---|---|---|
| Space | Booth rental, corner or island premiums | Usually one of the largest expenses. See our booth pricing guide |
| Exhibit | Booth design or rental, graphics, furniture, AV | Custom builds may be used across several events |
| Services | Electrical, internet, rigging, cleaning, drayage, lead retrieval | Drayage is easy to overlook at US shows |
| Logistics | Freight, storage, installation and dismantling | Costs vary considerably by venue |
| People | Travel, hotels, per diems and staff time | Staff time is still part of the investment |
| Promotion | Email campaigns, ads, sponsorships, giveaways and hospitality | Include any sponsorship package purchased for the event |
| Follow-up | SDR/BDR time, CRM tools and nurture campaigns | Leads only have value if they are followed up |
EXHIBITOR magazine’s 2026 Economic Outlook Survey found that 80% of respondents expected their 2026 exhibit programs to outperform their 2025 KPIs. But expectations alone do not show ROI. Start with a complete cost sheet.
Step 2: Track the right trade show ROI metrics
Not every metric tells you the same thing.
For exhibitors, useful trade show ROI metrics include:
| Metric | Formula | What it tells you |
|---|---|---|
| Cost per attendee reached | Total cost ÷ booth visitors | How efficiently your booth attracted visitors |
| Cost per lead | Total cost ÷ qualified leads | How much each qualified lead cost |
| Lead-to-opportunity rate | Opportunities ÷ leads | The quality of the leads generated |
| Pipeline generated | Total opportunity value | Potential revenue connected to the show |
| Closed-won revenue | Won deals attributed to the show | Actual revenue generated |
| ROI | (Revenue − cost) ÷ cost × 100 | Overall financial return |
| ROO | Objectives achieved ÷ objectives set | Results for non-revenue goals |
Cost per lead is especially useful, but only when everyone agrees on what a qualified lead actually means.
An older CEIR/Exhibit Surveys benchmark estimated the cost to close a trade-show-generated lead at roughly $811, compared with more than $1,000 for leads generated elsewhere. That figure is best treated as directional rather than a current benchmark.
Your own CRM data will give you a much more useful baseline.
Step 3: Decide how you will attribute sales
A deal rarely closes while the attendee is still standing at the booth.
That makes attribution important.
Before the event, decide:
- which CRM campaign or source will identify trade show leads;
- what qualifies as a lead;
- how long you will track those leads after the event;
- whether influenced opportunities count or only opportunities directly sourced from the show.
A 90-day attribution window may work for a short sales cycle. Enterprise sales may require six months or a year.
Whatever method you choose, define it before the show. Otherwise, it becomes too easy to change the rules once you see the results.
Step 4: Use the floor plan to generate more booth traffic
Trade show ROI is not only about measuring what happens after the event. Exhibitors can also improve the result before and during the show.
Booth location and visibility matter.
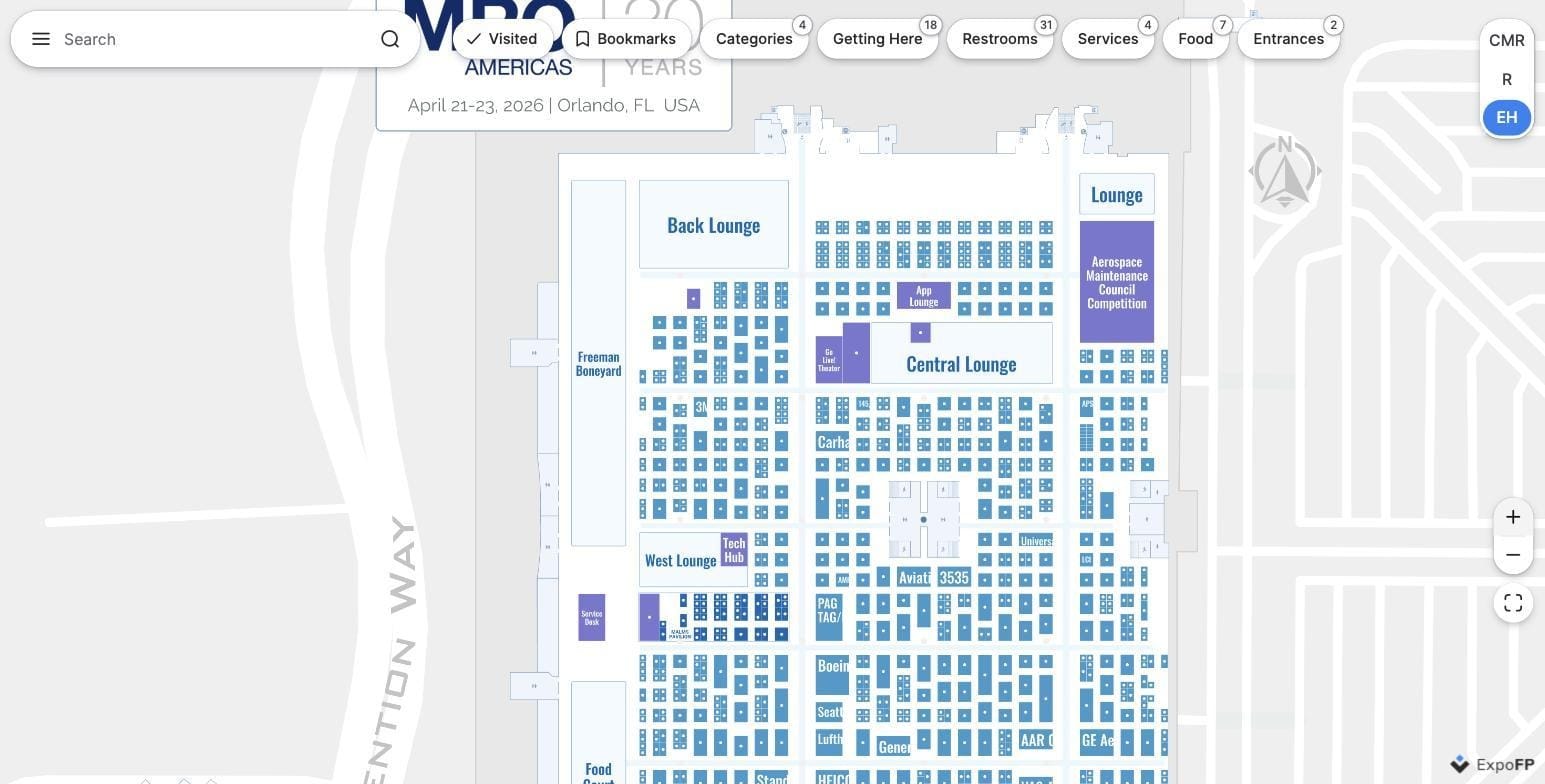
An interactive floor plan gives exhibitors several ways to increase visibility:
Complete the exhibitor listing. Add the company logo, description, product categories and relevant links so attendees can find the booth through search and filters.
Track pre-show interest. Bookmarks can show how many attendees were already interested in visiting a booth before arriving at the venue.
Use QR codes. QR codes on booths, printed materials and sponsorship placements give exhibitors another measurable interaction. See Enhancing exhibitor ROI with QR codes.
Consider nearby attractions. Booths close to entrances, theaters, lounges, food areas and other high-traffic locations may naturally receive more exposure.
Trade show ROI for organizers
Organizers measure ROI differently.
Revenue comes from booth sales, sponsorships, registrations and other event products. Costs include the venue, contractors, marketing, staff and technology.
But the most useful metrics are often the ones that help predict what happens at the next event.
Organizer ROI metrics to track
| Metric | Why it matters | Data source |
|---|---|---|
| Net square feet/m² sold | Measures how much sellable floor space was booked | Floor plan / booking system |
| Revenue per net sq ft/m² | Makes pricing easier to compare between events | Space revenue ÷ net area |
| Exhibitor renewal rate | Shows whether exhibitors saw enough value to return | Rebooking data |
| Exhibitor NPS | Measures exhibitor satisfaction | Post-show survey |
| Sponsorship yield | Shows how effectively sponsorship inventory was monetized | Sales records |
| Attendee quality | Shows whether the event attracted relevant buyers | Registration data |
| Cost per attendee acquired | Measures marketing efficiency | Marketing + registration |
| Floor plan engagement | Shows views, searches, bookmarks and routes | Interactive floor plan analytics |
| Traffic by zone | Helps identify popular and low-traffic areas | Floor plan analytics, badge scans or sensors |
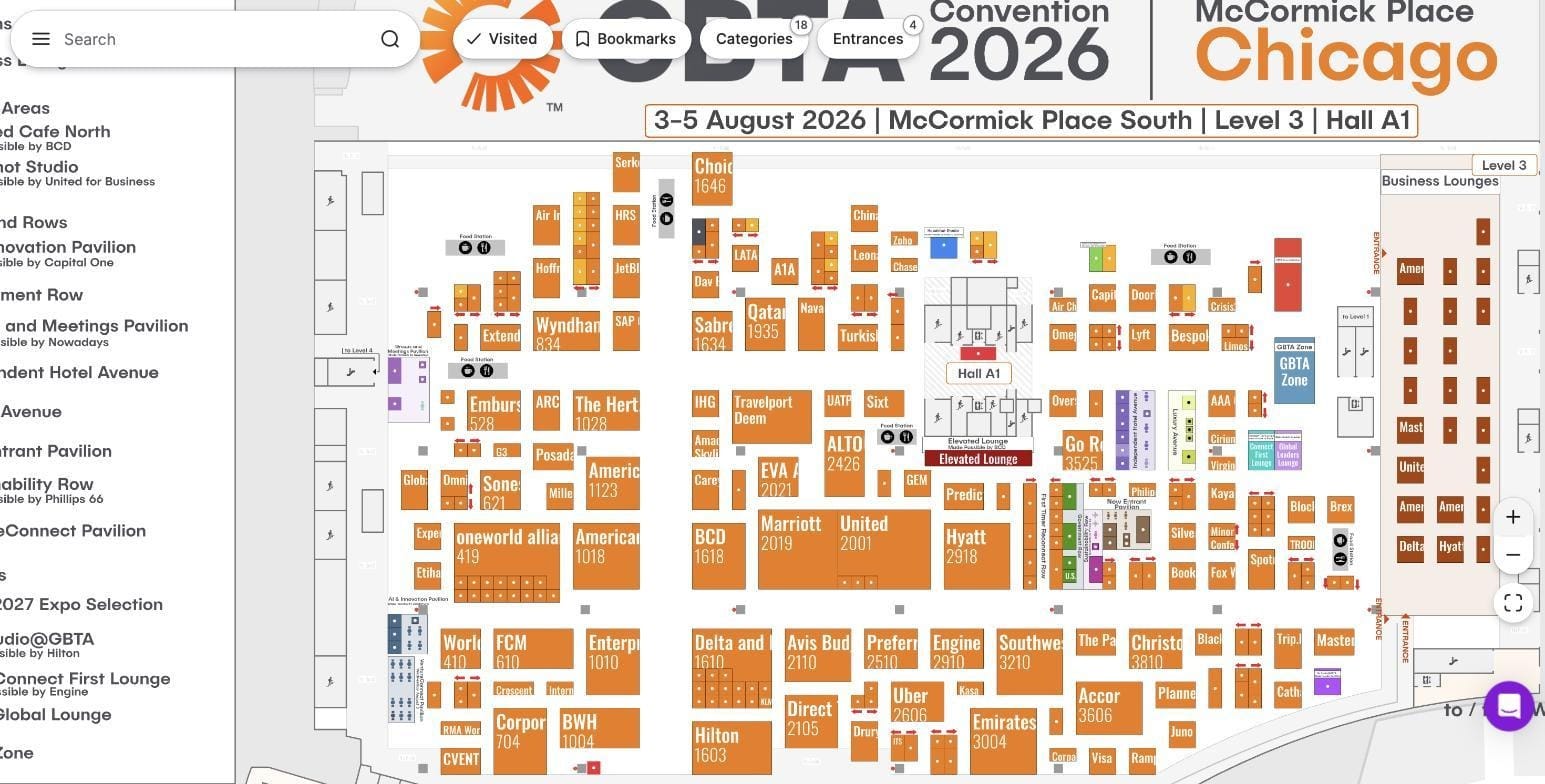
Where organizers can improve trade show ROI
Turn more floor plan space into sponsorship inventory
A floor plan contains more potential inventory than booths alone.
Lounges, pavilions, entrances, aisles and other areas can become sponsorship opportunities. The GBTA example above shows how sponsored areas can be incorporated directly into the event floor plan.
See our guide to 6 revenue streams from your floor plan for more ideas.
Give sponsors measurable results
A logo on the floor plan is useful. Data showing how attendees interacted with that placement is better.
Bookmarks, listing views, searches, routes and QR scans can help organizers show sponsors what their placement delivered.
That makes sponsorship ROI easier to explain when renewal conversations begin.
Start rebooking while exhibitors are still at the event
Organizers do not have to wait until weeks after the show to start selling next year's floor.
When booth availability and pricing are connected to an interactive floor plan, exhibitors can see available spaces and start the rebooking process while they are still at the venue.
See how to sell booth space online without spreadsheets.
Connect registration and the floor plan
Registration tells you who attended. The floor plan can tell you what they were interested in.
Connecting these systems gives organizers a clearer picture of attendee behavior and makes it easier to evaluate whether the right audience reached particular exhibitors, zones or sponsorship areas.
Read our registration-to-floor-plan integration guide for more details.
Trade show ROI example
Here is a simple example.
Assume a mid-sized exhibitor books a 20 × 20 ft (6 × 6 m) island booth at a US B2B trade show.
| Expense | Cost |
|---|---|
| Space | $18,000 |
| Exhibit rental + graphics | $14,000 |
| Electrical, internet, drayage and lead retrieval | $6,500 |
| Freight and installation/dismantling | $5,000 |
| Travel and hotel | $9,000 |
| Staff time | $12,000 |
| Pre-show promotion and giveaways | $4,000 |
| Post-show follow-up | $3,000 |
| Total | $71,500 |
After six months, the exhibitor has:
210 scanned leads → 84 qualified leads → 19 opportunities → 5 closed-won deals worth $310,000
That gives us:
Cost per qualified lead:
$71,500 ÷ 84 = $851
Cost per opportunity:
$71,500 ÷ 19 = $3,763
Trade show ROI:
($310,000 − $71,500) ÷ $71,500 × 100 = 334%
Now imagine that only three of those five deals were directly sourced from the show, while the other two were merely influenced by it.
Using $186,000 in sourced revenue:
($186,000 − $71,500) ÷ $71,500 × 100 = 160% ROI
Same event. Same leads. Different attribution rules.
That is why attribution needs to be defined before the event.
Measuring trade show ROI in the US vs Europe
The basic ROI calculation does not change, but some event conventions do.
| Topic | US | Europe |
|---|---|---|
| Space | Usually priced per square foot | Usually priced per square metre |
| Typical module | 10 × 10 ft / 100 sq ft | 3 × 3 m / 9 m² |
| Booth setup | Raw space and services are often separate | Shell scheme packages are common |
| Lead capture | Organizer badge scanning is common | Badge scanning is common, with GDPR considerations |
| Attribution | Sales-sourced revenue often receives more emphasis | Brand and relationship objectives may carry more weight |
| Benchmarks | CEIR, EXHIBITOR | UFI, AUMA and national associations |
The important part is consistency. Use the same definitions across your events so that the results are actually comparable.
Trade show ROI checklist
Before the show
- Calculate the full event cost, including staff time and follow-up.
- Define what counts as a qualified lead.
- Create the CRM campaign or source.
- Set the attribution window.
- Complete the exhibitor listing on the interactive floor plan.
- Add trackable QR codes to relevant materials and sponsorship placements.
During the show
- Capture leads with qualification information, not just badge scans.
- Compare daily lead numbers with your targets.
- Track meetings booked through the floor plan or matchmaking tools.
After the show
- Review floor plan analytics such as views, searches, bookmarks and routes.
- Add leads to the CRM quickly.
- Review pipeline after 30, 90 and 180 days.
- Compare the final results with the objectives set before the event.
- Use the data to decide whether to rebook.
How ExpoFP helps measure trade show ROI
ExpoFP interactive floor plans give organizers and exhibitors another source of measurable event data.
Exhibitors can create searchable company listings and give attendees an easier way to discover, bookmark and navigate to their booths.
Organizers can use floor plan engagement data to understand how attendees interact with exhibitors and different areas of the show. Online booth sales and sponsorship placements can also be connected to the same floor plan attendees use for navigation.
FAQ
What is a good trade show ROI?
There is no single benchmark that works for every event or industry. Deal size, sales cycle, event costs and the purpose of exhibiting all affect the result.
The most useful comparison is usually your own performance across different shows and marketing channels.
How do you calculate trade show ROI?
Use:
(Revenue attributed to the show − Total show cost) ÷ Total show cost × 100
Include the full cost of exhibiting, including staff time and follow-up, and define your attribution rules before the event.
How is organizer ROI different from exhibitor ROI?
Exhibitors usually compare leads, pipeline and revenue with the cost of attending a show.
Organizers look at metrics such as booth sales, revenue per square foot or metre, exhibitor renewals, sponsorship revenue and attendee quality against the cost of producing the event.
The two are connected. Exhibitors that can prove their own ROI are more likely to renew.
What is the average cost per lead at a trade show?
There is no universal number. Cost per lead varies significantly by event, industry and the definition of a qualified lead.
A better benchmark is your own:
Total trade show cost ÷ Qualified leads
Track it consistently across events to see which shows perform best.
Can floor plan analytics really affect ROI?
Yes, in two ways.
For exhibitors, bookmarks, listing views and routes can show how much pre-show and on-site interest a booth generated.
For organizers, the same data can help demonstrate sponsorship value, compare areas of the exhibition floor and identify places where attendee engagement could be improved.
Sources
- CEIR 2026 Marketing Spend Decision Report via Trade Show Executive
- IAEE: 2026 CEIR Index Report
- UFI Global Exhibition Barometer, January 2026
- EXHIBITOR magazine 2026 Economic Outlook Survey